


Assessments In Dubai Buildings: Visual Reports For
In Dubai‘s rapid construction boom, Visual Reports for Environmental Risk Assessments in Dubai Buildings have become indispensable. These reports translate intricate indoor environmental data—such as mold growth, air quality issues, and water contamination—into clear, visual formats that homeowners, property managers, and regulators can easily grasp. With Federal Decree-Law No. 11 of 2024 mandating emissions monitoring from 30/05/2025[1][2], visual reporting ensures compliance while highlighting health risks in UAE’s hot, humid climate.
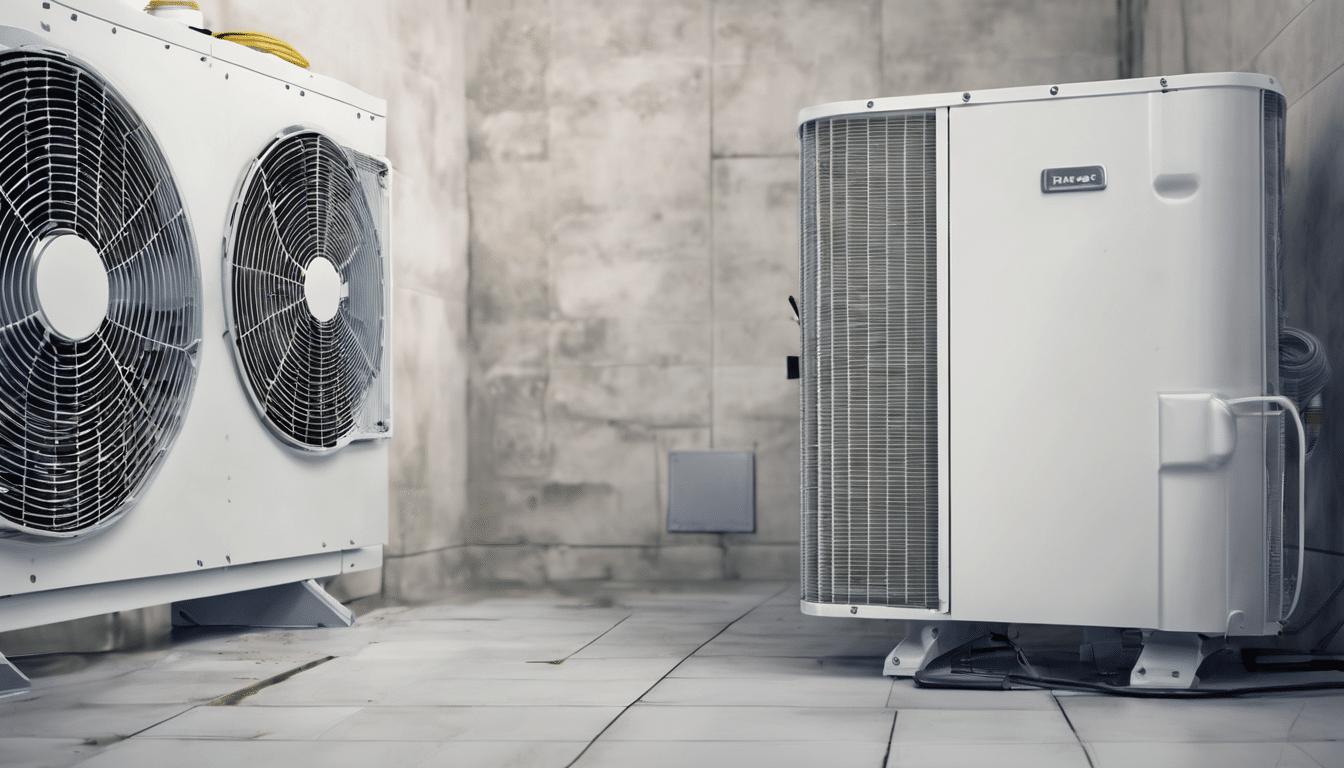
Dubai buildings face unique challenges: constant air conditioning creates thermal bridges leading to hidden condensation, while rooftop water tanks breed bacteria in 40°C summers. Effective Visual Reports for Environmental Risk Assessments in Dubai Buildings empower stakeholders to act swiftly, preventing costly remediation averaging AED 50,000–200,000 per villa. As CTO at Saniservice, I’ve pioneered these reports, combining my architecture and microbiology expertise to make invisible threats visible.
Understanding Visual Reports for Environmental Risk Assessments in Dubai Buildings
Visual Reports for Environmental Risk Assessments in Dubai Buildings integrate graphs, heatmaps, and infographics to depict risks like elevated PM2.5 levels or mold spore counts. Unlike text-heavy documents, these reports use colour-coded charts to show humidity exceeding 60% RH in wall cavities—common in Dubai’s AC-driven environments.
From my experience directing Saniservice’s Indoor Sciences division, these reports bridge technical findings with client understanding. They detail root causes, such as hygrothermal dysfunction at wall-floor junctions, prevalent in UAE villas built post-2010[1].
Core Components
Every report starts with a building overview: floor plans annotated with risk zones. Metrics include VOC concentrations in ppb and radon levels in Bq/m³, aligned with IAC2 standards I hold.
Why Visual Reports for Environmental Risk Assessments in Dubai Buildings Matter
In Dubai, where 90% of time is spent indoors, poor air quality triggers oxidative stress and respiratory issues. Visual Reports for Environmental Risk Assessments in Dubai Buildings make these risks tangible, showing spore maps that reveal hidden mold behind skirting boards—a frequent finding in my investigations.
Property values drop by 10-20% with undisclosed environmental issues. These reports facilitate informed decisions for real estate agents in areas like Jumeirah or Downtown Dubai.
Key Elements of Effective Visual Reports for Environmental Risk Assessments in Dubai Buildings
Essential features include interactive dashboards with zoomable thermal images at 25°C dew points. Visual Reports for Environmental Risk Assessments in Dubai Buildings must feature risk matrices: low (green), medium (yellow), high (red) for contaminants like E. coli in water tanks.
Include before-after comparisons, such as post-remediation air quality dropping from 500 spores/m³ to under 100.
Compliance Integration
Link findings to Federal Decree-Law No. 11, requiring GHG data retention for 5 years[4]. Visual timelines track emission reduction progress.
9 Essential Visual Reports for Environmental Risk Assessments in Dubai Buildings
Here are the 9 essential Visual Reports for Environmental Risk Assessments in Dubai Buildings, drawn from Saniservice’s microbiology lab protocols.
- Thermal Imaging Heatmaps: Reveal 5-10°C cold bridges causing 70% RH condensation.
- Mold Spore Distribution Charts: Pie graphs showing Aspergillus dominance in 80% of Dubai cases.
- Air Quality Trend Lines: Graphs plotting PM2.5 spikes during sandstorms.
- Water Contamination Bar Graphs: Coliform counts per 100ml in rooftop tanks.
- Humidity Contour Maps: 3D visuals of 65%+ zones in villas.
- Radon Concentration Isobars: Ground-floor peaks over 200 Bq/m³.
- VOC Heat Risk Matrices: Formaldehyde levels from new furnishings.
- Biofilm Growth Timelines: Progression in HVAC ducts over 6 months.
- Remediation Progress Dashboards: Gantt charts for AED 75,000 projects.
These Visual Reports for Environmental Risk Assessments in Dubai Buildings ensure clarity for non-experts.
UAE Regulations Impacting Visual Reports for Environmental Risk Assessments in Dubai Buildings
Federal Decree-Law No. 11 mandates MRV of Scope 1/2 emissions from 30/05/2025, with fines up to AED 2 million[1][5]. Visual Reports for Environmental Risk Assessments in Dubai Buildings must include verified GHG data, aiding Dubai Municipality compliance.
For indoor risks, DM’s green building regs require IAQ documentation. Visual formats support adaptation plans for health sectors[4].
Case Studies: Visual Reports for Environmental Risk Assessments in Dubai Buildings
In a Jumeirah villa, our thermal heatmap in a Visual Report for Environmental Risk Assessments in Dubai Buildings exposed mold behind skirting boards due to slab-edge bridging. Post-report remediation cleared 95% contamination for AED 120,000.
Another Abu Dhabi case used spore charts to trace E. coli to biofilms, visualised in bar graphs—leading to tank cleaning and filtration install.
ROI Demonstration
Clients recoup costs: one report prevented AED 500,000 in health claims.
Best Practices for Creating Visual Reports for Environmental Risk Assessments in Dubai Buildings
Use consistent colour scales: blue-low risk, red-high. Ensure mobile compatibility for Dubai’s on-site managers. Visual Reports for Environmental Risk Assessments in Dubai Buildings should include QR codes linking to raw data.
Personalise with villa photos overlaid on risk maps.
Tools and Software for Visual Reports for Environmental Risk Assessments in Dubai Buildings
FLIR Tools for thermal exports; Tableau for dashboards. Our lab uses custom PHP/MySQL platforms for real-time Visual Reports for Environmental Risk Assessments in Dubai Buildings.
Free options: Canva Pro (AED 50/month) for infographics.
Expert Tips for Using Visual Reports for Environmental Risk Assessments in Dubai Buildings
- Start with executive summaries using icons.
- Reference UAE NDCs for credibility[2].
- Train staff on interpreting heatmaps.
- Update annually per Decree-Law timelines.
The Future of Visual Reports for Environmental Risk Assessments in Dubai Buildings
As UAE pushes net-zero by 2050, Visual Reports for Environmental Risk Assessments in Dubai Buildings will integrate AI predictive analytics. From my 12+ years at Saniservice, these tools not only comply with regs but safeguard health in our desert climate. Adopt them now to avoid penalties and protect assets.
JV de Castro, IAC2
JV de Castro is the Chief Technology Officer at Saniservice, where he leads innovation in indoor environmental sciences, IT infrastructure, and digital transformation. With over 20 years of experience spanning architecture, building science, technology management, digital media architecture, and consultancy, he has helped organizations optimize operations through smart solutions and forward-thinking strategies. JV holds a Degree in Architecture, a Masters of Research in Anthropology, an MBA in Digital Communication & Media, along with certifications in mold, building sciences and advanced networking. Passionate about combining technology, health, and sustainability, he continues to drive initiatives that bridge science, IT, and business impact.


Leave a Reply